By studying the CMB light from the early Universe, cosmologists can learn much about the Universe.
The Planck satellite has made exquisite maps of the microwave sky at multiple frequencies with multiple detectors per frequency. As well as the CMB light from the early Universe, the maps also contain light emitted from our Galaxy and indeed other galaxies. In addition the detectors are not perfect and the maps are noisy. These complications all have to be dealt with in order to make accurate inferences about the Universe.
Below are representative full-sky maps at 100 GHz, 143 GHz, and 217 GHz; note how the galactic contamination across the centre of each map varies.
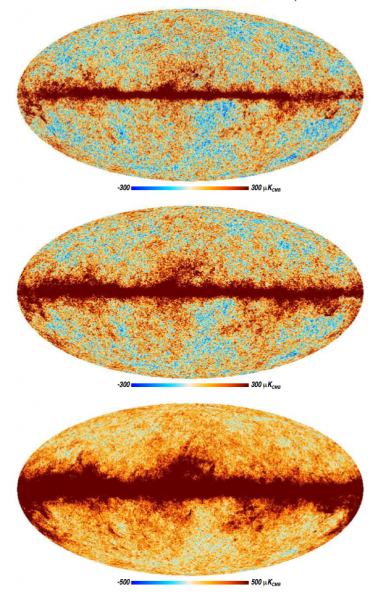
Figure: All-sky maps of the microwave sky at frequencies of 100 GHz (top), 143 GHz (middle), and 217 GHz (bottom) from Planck HFI. (Image credit: ESA and the Planck Collaboration.)
The Planck team at Cambridge, working in collaboration with colleagues in Paris and elsewhere, has played a key role in the development of the “Planck likelihood”, the scheme, expressed in computer code, that compares theories to the Planck data.
Most cosmological models assume the Universe starts off smooth, dense, and expanding. The CMB is thought to have been emitted only a few hundred thousand years after the big bang, and more than 90% of it has freely travelled through space for the remaining fourteen billion years of cosmic history. The smoothness of the early Universe ties in with the observed near uniformity of the CMB temperature — it only varies by about one part in a hundred thousand as one looks in different directions across the sky.
Cosmological models differ in their predictions of the details of the correlations between the small fluctuations of the CMB temperature from different directions. If one picks two neighbouring directions, the fluctuations in the temperature of the CMB away from the mean will be very similar. So if, say, the light from one direction is more intense then so will be the light from the other. As the angle between the directions increases, the amount of correlation will change. One theory might have the correlation falling off more rapidly with angle than the other.
These properties of correlations are expressed mathematically by “angular power spectra”. The key idea of the likelihood is to compare the angular power spectra predicted by the theory to those seen by Planck, and to quantify correctly the discrepancy between the two. The worse the discrepancy, the more the likelihood penalizes that model.
Note the use of “spectra” not “spectrum”. This is because the CMB light coming from a given direction in space has both an intensity and a polarization. The Planck detectors are able to measure both and we can look at intensity-intensity, intensity-polarization and polarization-polarization correlations.
Indeed, one of the major advances of Planck from the previous WMAP satellite is its ability to measure polarization well enough to make quality spectra involving polarization. The Planck mission has had two cosmological data releases so far, in 2013 and in 2015. The polarization data were not used in the 2013 analysis, but with better processing their quality had improved sufficiently to allow their incorporation into the 2015 release.
Spectra are typically presented as shown below, plotted as an amplitude, giving the strength of correlation, against “multipole moment”, an inverse angle of separation. The Planck team finds models that fit the data so well that, in addition to showing Planck’s spectra, it makes sense to plot also the difference or “residuals” between the spectra and a representative best-fit model. This allows one to get a visual impression of just how well the modeling is doing. The composite spectra shown below are from a combination of spectra from carefully chosen selections of our 2015 maps, to get our “best” spectra to show. (Note that TT denotes a temperature-temperature measurement, TE denotes a type of temperature-polarization one, and EE a type of polarization-polarization one.)
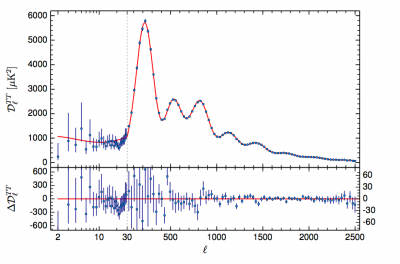
Figure: Planck 2015 temperature angular power spectrum. The red line is the best-fitting LCDM model (see below) to the data points, with the residuals of the data with respect to this model shown in the lower panel. (Image credit: ESA and the Planck Collaboration.)
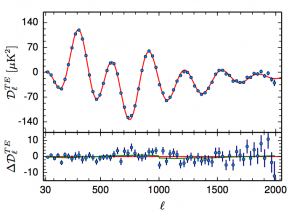
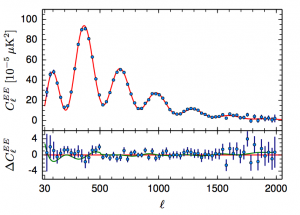
Figure: Planck 2015 temperature-polarization (left) and polarization-polarization (right) angular power spectrum. The red line is the same LCDM model as above, i.e., it is fit to the temperature power spectrum and not to the polarization spectra, showing very good consistency of this model with the polarization data. (Image credit: ESA and the Planck Collaboration.)
By eye, the data and the model seem to agree very well. However, one of the trickiest parts in the construction of a likelihood function is in determining just how much variation between the theory power spectra and the observed ones should be allowed. The observed spectra have intrinsic fluctuations in them, as well fluctuations from the instrument noise and the non-CMB light in the maps as mentioned above. With this done though, one can go on to compare quantitatively tens of thousands of cosmological models to the data and build up a picture of what our Universe is plausibly like.
This analysis, led by Antony Lewis of the University of Sussex and supported by members of the KICC group, used hundreds of thousands of CPU hours on the Cambridge “Darwin” and “Cosmos” supercomputers, both for the 2013 and 2015 releases.
For both data releases it was found that the simplest model consistent with older data was also consistent with Planck, albeit with somewhat shifted parameters. Planck, with its improved sensitivity and resolution, naturally constrains the parameters of the model somewhat more tightly than analyses based on WMAP data.
The 2015 results improved on the 2013 ones by the inclusion of polarization, but also by the use of more data from the satellite going in to each map and enhanced analysis techniques coming from a deeper understanding of the data.
The consistent model is called the “Lambda-CDM (LCDM) cosmology”. Here Lambda indicates the presence of a cosmological constant, after the Greek letter conventionally used to describe its strength. CDM is for “cold dark matter”, indicating that the model requires additional matter of a type different from, and that interacts only weakly with (hence dark), the matter we know about from experiments on Earth, and that this matter has to be slowly moving relative to the speed of light even at early times (hence cold).
The 2013 results are broadly consistent with the 2015 ones. Furthermore one can check how the 2015 results change if one performs the analysis with or without inclusion of the polarization data in addition to the temperature data. The parameters are highly consistent between the analyses, as shown below.
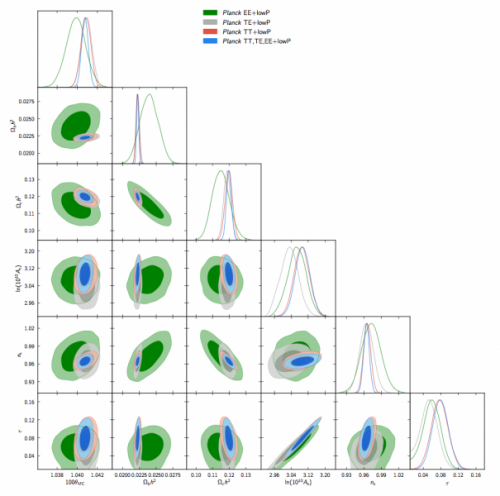
Figure: Comparison of the six parameters of the LCDM model determined from the Planck temperature data (red), temperature plus polarization (blue), the polarization-polarization spectrum only (green), and the temperature-polarization spectrum only (grey). (Image credit: ESA and the Planck Collaboration.)
This consistency gives us confidence in our handling of subtleties such the contaminating light mentioned above, as it affects polarization much less than it affects temperature.
One can also add external data such as that from baryon ccoustic oscillation measurements (BAO) from galaxy redshift surveys, providing additional constraining power and again yielding highly consistent results, as shown below.
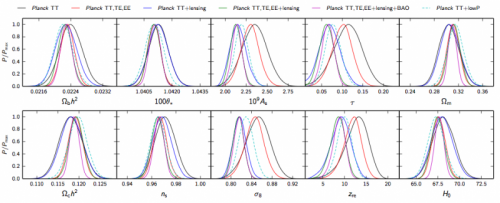
Figure: Constraints on parameters of the LCDM model from various combinations of the Planck data and BAO data. Here, lensing refers to Planck’s measurements of the effect of gravitational lensing on the CMB. (Image credit: ESA and the Planck Collaboration.)
Many extensions to the LCDM model have been proposed as plausible cosmological models. These include models with additional neutrino-like particles, non-Euclidean spatial geometry, modifications to the form of the primordial fluctuations in the early Universe, and non-standard synthesis of light chemical elements. The following plot shows that the Planck data do not strongly favour any such extensions to the base LCDM model.
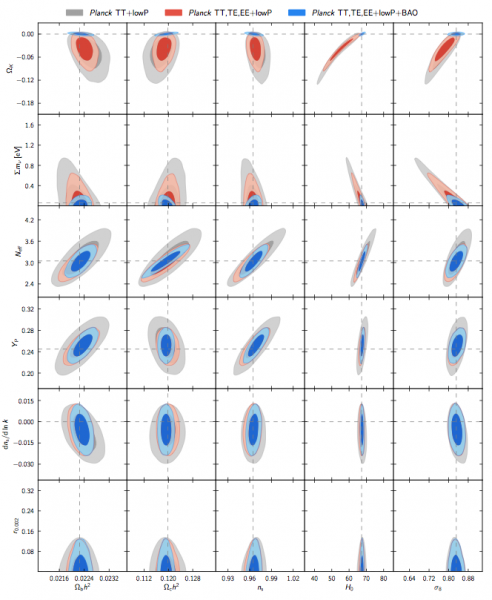
Figure: Constraints on the parameters of extended models for various combinations of the Planck data and BAO data. Each model has one additional parameter that is allowed to vary over and above the six parameters of the LCDM model; the correlations of this additional parameter with parameters of the LCDM model are shown in each row. The horizontal dashed lines show the values that the additional parameters are fixed to in the LCDM model. (Image credit: ESA and the Planck Collaboration.)
Measuring the variation of the polarization on the largest angular scales is very challenging even for Planck, and the 2015 analysis was very conservative here. Looking ahead to 2016, a further release with improved polarization handling offers a fresh opportunity for Planck to improve our understanding of the Universe.