Planck has made maps of the sky in nine frequency channels from 30 GHz to 857 GHz, corresponding to wavelengths of 1 cm to 0.35 mm. The maps contain not only CMB but also emission from our Galaxy and extragalactic sources. These other sources of emission are between us and the CMB, so they are collectively called "foregrounds". The Galactic foregrounds are the most obvious, since they appear as a bright band across the centre of the frequency channel maps.
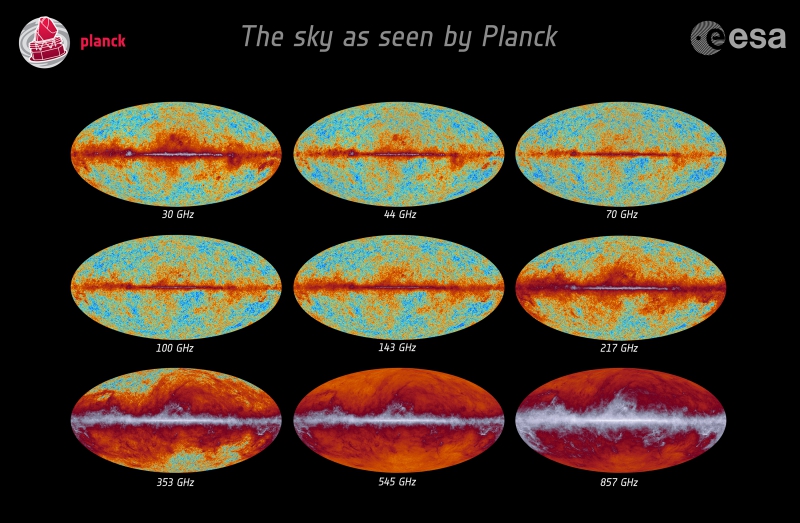
Figure: Planck frequency channel maps. (Image credit: ESA and the Planck Collaboration.)
The foreground emission is produced by a number of different physical processes. At low frequencies/long wavelengths the foregrounds are dominated by synchrotron radiation, which is caused by electrons spiralling in magnetic fields. At high frequencies/short wavelengths the foregrounds are dominated by thermal emission from interstellar dust grains. In order to make a map of the CMB over the whole sky, it must be separated from the foreground emission. This is done by taking advantage of the fact that the CMB and the foregrounds have different frequency spectra. The frequency channel maps are analysed using our knowledge of the frequency spectra to produce maps of the CMB and foregrounds.
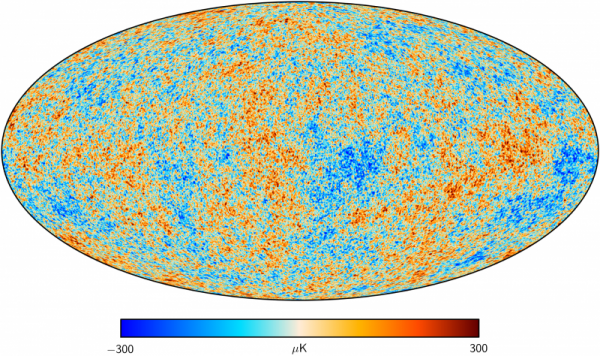
Figure: Map of the CMB temperature fluctuations measured by Planck. (Image credit: ESA and the Planck Collaboration.)
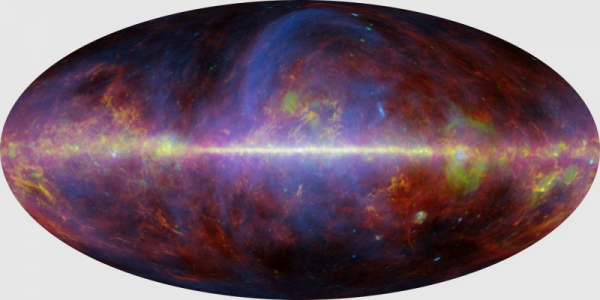
Figure: Composite map of foreground emission (synchrotron, free-free, spinning dust, CO and thermal dust). (Image credit: ESA and the Planck Collaboration.)
Seven of the frequency channels are sensitive to polarization, from 30–353 GHz. The component separation procedure can be applied to the polarization maps too. Only some of the foreground emission is polarized, which means that there are fewer components to separate, but the CMB polarization signal is also much smaller.
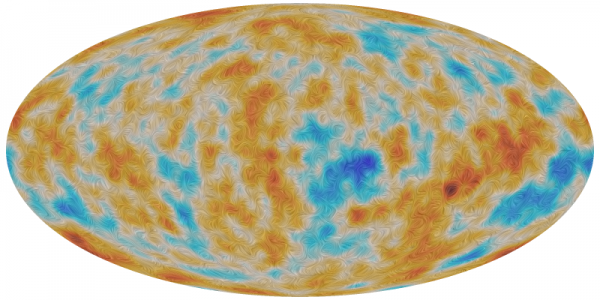
Figure: CMB polarization map, filtered at 5-degree scale. (Image credit: ESA and the Planck Collaboration.)
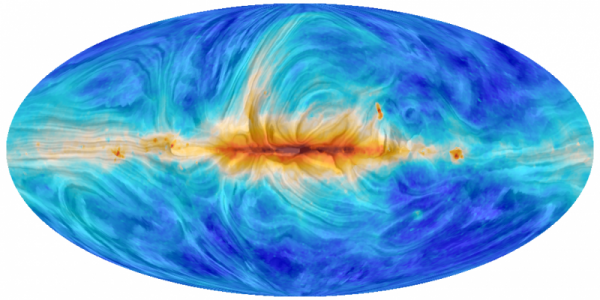
Figure: Synchtrotron polarization map. (Image credit: ESA and the Planck Collaboration.)
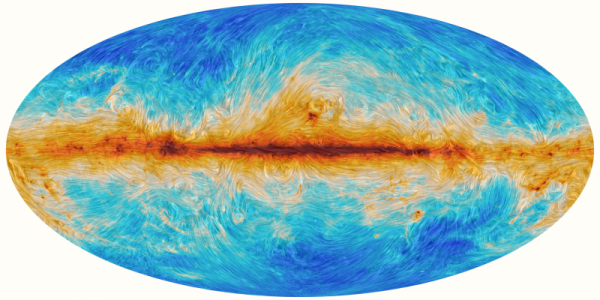
Figure: Dust polarization map. (Image credit: ESA and the Planck Collaboration.)